Disclaimer: This article constitutes the author’s personal views and is for entertainment and educational purposes only. It is not to be construed as financial advice in any shape or form. Please do your own research and seek your own advice from a qualified financial advisor. From time to time, the author holds positions in the below-mentioned stocks consistent with the views and opinions expressed in this article. This is a disclosure - not a recommendation to buy or sell stocks.
The Results
During Q1 2025, the JB Global Capital Fund increased by 41.4%, reaching an all-time high on March 17th, 2025. Since inception, the fund has appreciated by ~83%, doubling the return of the S&P 500. Relative to the VT Total World Stock Index and the S&P, we have outperformed by a significant factor. The outperformance of the fund has been the result of:
High exposure to Chinese Equities (purchased at bargain prices) ~68% of total portfolio
Moderate exposure to U.S. Treasuries ~14% of total
Minimal exposure to U.S Tech Stocks
Depreciation of the U.S. Dollar
The S&P 500 experienced a drawdown during the first quarter — largely in part to U.S government policies that have increased uncertainty for investors, business leaders, and global trading partners. The first 72 days of the Trump administration have been marred by inconsistent communication, erratic behavior from the world's richest man involving a chainsaw, a massive blunder from the secretary of defense, and a deportation “error”. These actions ultimately sow distrust in the current administration — saying nothing of the blatant conflict of interest regarding the President's involvement in cryptocurrency. From an investment perspective however, the most central issue in Q1 has been the administrations global trade war with allies and adversaries alike.
In a general sense, decisions are made in pursuit of a clearly defined and logical goal. The stated goal(s) of the Trump administration's use of tariffs are both unclear and contradictory. President Trump has stated that tariffs will generate “trillions of dollars” in revenue AND bring manufacturing back into the country. However, if the tariffs incentivize companies to make more of their products in the United States, American consumers will buy fewer imported goods. As a result, tariffs would generate less revenue for the government. As an aside, manufacturing is the most commoditized part of the value chain. Investing in manufacturing in the U.S is an inefficient use of resources that ultimately make businesses less competitive globally.
Another stated aim for tariffs is to force Canada, Mexico, and China to stem the flow of fentanyl and illegal immigration into the United States. If the countries were to oblige and meet his demands, the president would be expected to drop his threat of tariffs. As a result, no additional revenue would be raised and companies would not have a reason to move production to the United States — nullifying both original goals. To make matters worse, communication regarding tariffs has been untethered from reality with the President and Press Secretary Karoline Leavitt continually repeating that “tariffs are paid by foreign countries and not American consumers”, a statement factually equivalent to saying 2+2=5.
Edit: Since writing this, the Trump administration has announced reciprocal tariffs on nearly all trading partners (except Russia) alongside economically illiterate calculus and reasoning, wiping “trillions and trillions of dollars” off markets globally.
If you are enjoying the write-up, make sure to subscribe for more!
Portfolio Company Updates:
As the largest position in the fund, Alibaba’s shares play a leading role in our performance quarter to quarter. The company reported positive earnings during the quarter, surpassing analysts’ expectations for both top and bottom line, sending shares higher by 16% since the announcement. The company has returned to a more normalized growth rate in their core business (Taobao and Tmall Group) while re-accelerating growth in their international retail and cloud computing business units. Management attributed this growth to investments in user experience and higher monetization methods through software service and payment processing fees. Growth at Alibaba Cloud has been backed by triple-digit growth of A.I. related product revenue for the sixth consecutive quarter. We find that this is indicative of the growing adoption of A.I. in China and the leadership of Alibaba’s cloud business. (~36% Market Share as of Q4 2024)
You can read our full review of Alibaba’s latest earnings results HERE.
In our previous discussion we spoke about the concept of reflexivity, stating,
“The concept boils down to diminishing the distinction between subject (thinking participant/investor) and object (market prices/company fundamentals). The object is affected by the subject’s thinking/behavior which then reinforces the subject’s thinking/behavior, (i.e. a feedback loop). A reflexive change in narrative ultimately leads to bull markets as investor sentiment improves, leading to higher capital flows, which businesses can then exploit through equity and debt markets to generate higher returns.”
It is our opinion that the 60% increase in Alibaba’s shares in Q1 are the result of a reflexive shift in narrative for both the company and Chinese tech stocks as a group. While we are comfortable with our current allocation, we have trimmed the position and used the proceeds to purchase shares in two new positions.
Portfolio Additions:
The Hershey Company (Ticker: HSY 0.00%↑)
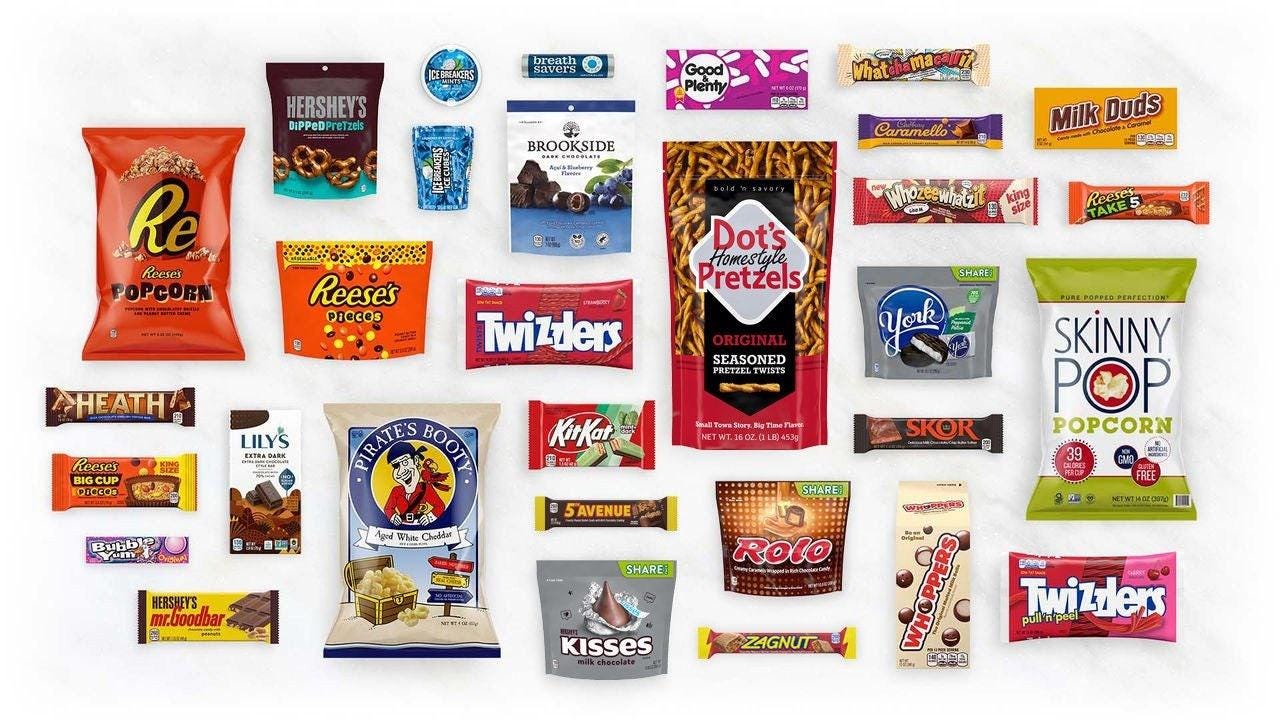
The Hershey Company is one of America's most iconic chocolate manufacturers. Founded in 1894 by Milton Hershey, the company began with caramels before focusing on chocolate production. Their first and most famous product was the Hershey's Milk Chocolate Bar, which helped democratize chocolate in the U.S. by making it affordable for average consumers. Today, Hershey is a global confectionery leader with a diverse portfolio including Reese's, Kit Kat, Twizzlers, and many other beloved brands.
Hershey's brand power and cost advantages have given the company a wide economic moat — underpinned by its 36% market share position in the U.S. The business has generated a ROIC averaging over 20% for the past decade, well above any reasonable estimate for Hershey’s cost of capital. High ROIC (relative to WACC) alongside market share stability indicate a dominant firm’s ability to fund growth internally. The company’s shares have been under pressure more recently due to a combination of factors including high cocoa prices and the popularization of GLP-1 weight loss drugs (Ozempic and the like), which artificially curb appetite.
Our investment thesis is founded in the temporary nature of these concerns; Cocoa prices have been distorted through supply shocks and non-physical market factors such as:
Disease outbreak in West Africa
Bad weather conditions
Speculative activity in the cocoa futures market in New York (ICE)- Link
While these factors will put temporary pressure on forward earnings (25’-26’), we believe that the business has cost advantages that will help it mitigate the impact better relative to competitors. The narrative of GLP-1 drugs hampering demand has been priced into the confectionery market. We also believe that Hershey’s long history demonstrates strategic capabilities to adapt to changing consumer habits. We estimate that the business is currently trading around EPV value and with a dividend yield of ~3.5% — we don’t mind waiting for Hershey’s operating environment to normalize.
Nike Inc (Ticker: NKE 0.00%↑)
Nike is a global athletic footwear and apparel giant founded in 1964 as Blue Ribbon Sports before rebranding to Nike in 1971. The company has built its dominance through innovative product design, aggressive marketing strategies featuring high-profile athlete endorsements, and a powerful brand identity. The company operates through a diversified business model that includes direct-to-consumer (DTC) sales via its retail stores and digital platforms, as well as wholesale distribution to retailers in 190+ countries. While Nike has successfully expanded beyond its initial running shoe focus to encompass athletic apparel and accessories, footwear accounts for 2/3 of overall sales.
Footwear is a simple product to understand, made typically of leather, rubber, foam, and synthetic materials. However, simple does not mean insignificant. There are more nerve endings per square centimeter in the foot than any other part of the body. Our feet constantly supply us with vital information, without our being consciously aware of it. As such, comfortable footwear is deeply connected to the limbic system, regulating emotions, memory, motivation, and social behavior. Being that the product is simple to reverse engineer, it is highly unlikely that a new entrant will create a more comfortable running sneaker that Nike couldn’t simply copy. This is good news.
The deep reality of Nike’s business model is that it relies heavily on building and maintaining mindshare (brand equity) among consumers (~$4.5B on marketing per year). The transcendental nature of Nike’s branding ties it to an ideal that deeply resonates with the human spirit; the drive to succeed, to accomplish, to win etc. The “Just do it” slogan is a celebration of decisive action vs. nervous hesitation, a message that travels across demographics and culture, again speaking directly to the human spirit.
As the dominant leader in global sportswear (~18% vs 9% for Adidas), Nike can lead the sports advertising market through simply outspending competitors or through brand momentum. Who else can afford lifetime deals with Cristiano Ronaldo, Lebron James, Kevin Durant while at the same time paying to be the uniform provider of the NFL, NBA, and MLB? With structural profitability (6B FCF per year), and very little net debt, we don’t see this advantage changing anytime soon. As evidence of its competitive edge, Nike’s adjusted ROIC, including goodwill, have averaged 36% over the past 5 fiscal years — well above any reasonable estimate for cost of capital.
So why are shares so cheap today, relative to historical levels? Three main reasons:
Strategic Misstep: Nike’s attempt to shift sales from retail partners to DTC (where they have better margins) backfired as they underestimated the stickiness of consumer habits. Instead, what occurred was that Nike gave up valuable shelf space to competitors and sales have fallen by nearly double digits.
Tariffs: Nike doesn’t manufacture any of their products. The company uses third-party contract manufacturers in Vietnam, Indonesia and China (50%, 27% and 18% respectively). Fun fact: Approximately 99% of footwear that is sold in the US is imported, primarily from Asia.
Increasing recession risk (partly from tariffs) puts pressure on Nike’s sales globally.
Similar to our discussion on Hershey, we find that these issues are temporary in nature and are immaterial in comparison to the competitive positioning of the company and the structural profitability of their operations.
The Portfolio
Since inception, we have made 19 investments in 9 industries as classified by Morningstar. While the investments span throughout various sectors, there is material concentration in the sectors of internet retail, financial services, and cloud computing. We anticipate high volatility in the fund due to portfolio concentration, emerging market risk (largely in China), and a contrarian investment strategy. We thank our partners and readers for their continued support.
With great appreciation,
Jack Beiro, MBA
JB Global Capital
The information contained herein represents the author’s opinion and is for informational purposes only. Nothing in this newsletter should be construed as legal, tax, investment, or financial advice. No opinion expressed by the author should be construed as a specific inducement to make a particular investment or follow a particular strategy. The author may hold positions in securities mentioned in the newsletter and may buy or sell securities at any time. The author may express opinions based on information he considers reliable, but no guarantee or warranty is made with respect to such information’s completeness or accuracy, and the author is under no obligation to update or correct any information provided. Please consult your own financial or investment advisor before acting on any information provided herein.


