


The Results
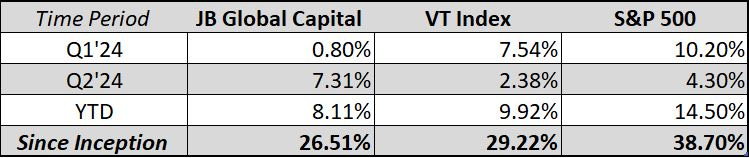
The JB Global Capital Fund increased by 7.31% in the second quarter ending June 30th, 2024. This compares to 2.38% for the Vanguard Total World Stock Index Fund (VT), and 4.30% for the S&P 500. Our relative outperformance was due to positive developments in our core holdings amidst a slight-slowdown in the U.S. consumer market. While the Fund outperformed in Q2, we are still underperforming on a YTD basis and since inception. (See above chart for results) The underperformance longer-term stems from our exposure to Chinese equities such as Alibaba, JD.com, and Tencent, while U.S. equities have gone from strength to strength, largely shrugging off rising interest rates and signs of a weakening consumer. Although Chinese equities have begun to recover in Q2, they have been marred by setbacks related to a struggling consumer market and geopolitical trade tensions that have increased in China’s effort to export themselves out of an economic malaise.
Meanwhile, in the United States, the big tech trade continues to gain strength. Drilling into the second quarter’s biggest winners, tech and large-growth stocks, a common thread appears. A few major players capitalizing on artificial intelligence continued carrying the market. Those stocks are AI giants Nvidia, Microsoft, Apple, Amazon.com, Meta Platforms, Alphabet, and Broadcom. These seven companies have contributed 24.39% of the 44.23% gained by the market since the start of last year.
Portfolio Company Updates:
StoneCo STNE 0.00%↑
As of May 9th, 2024, we have sold our entire position in the Brazilian merchant acquirer business StoneCo, for a net return after tax considerations of 61.4%. This sale provides us with an opportunity to discuss our thinking when it comes to selling a portfolio company and analyze the facts and reasoning behind our decision.
We published our original investment thesis for StoneCo on March 18th, 2023. In the write-up, we discussed the business overview, qualitative and quantitative factors affecting the business, and our thoughts on the investment opportunity. Our thesis was backed by three fundamental ideas:
The business was selling far below our estimate of intrinsic value.
The risks that created the value opportunity were well-known (priced-in), transitional in nature, and non-fatal.
The market seemed to be ignoring interest rate optionality which would’ve significantly changed the P&L of the company.
We were very fortunate in that our #3 played out in quick fashion as inflation in Brazil continued its decent throughout our holding period. This allowed our #2 to be priced in accordingly and ultimately addressed our #1, bridging the gap between an extreme undervaluation to a more rational price, which brings us to our reason for selling the stock.
Material Changes to the Risk/Reward Opportunity
Our first step in valuing any business is to begin with the Net Asset Value (NAV). We start with this approach as it provides the most conservative estimate of what the business is worth in its current state, ignoring any forecast about the future earnings stream. We begin with the balance sheet and examine the stated asset values at the end of the most recent operating period. We know that the stated accounting values are going to be more accurate for some assets compared to others. (i.e. current tangible assets like Cash vs. long-term intangibles like Goodwill) As such, we adjust stated values based on our opinion of their reliability. When we first published our thesis for StoneCo, our NAV Model was as follows:
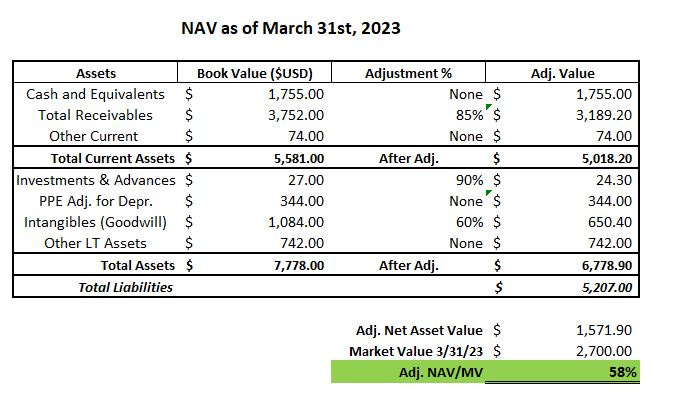
Based on our model, we saw that the company was trading under its stated NAV of USD $2,571B. After adjusting for accounting reliability, we still had ~60% of the market cap protected on the downside by net asset values, of which the majority being held in tangible current assets. With relatively little value given to the earnings power, what we expected to find was a struggling business with bad economics and weak prospects. Instead, we found a business that grew sales 26% from the previous year with a gross profit margin of 70%, an operating margin of ~45%, and free cash flow to be reinvested as the company saw fit. Furthermore, Brazil’s POS terminal market was expected to grow at a CAGR of 17.8% through 2028, with highly favorable trends in smartphone penetration, digital payments, and e-commerce. These combined characteristics did not make for a bad business.
So what changed in a year?
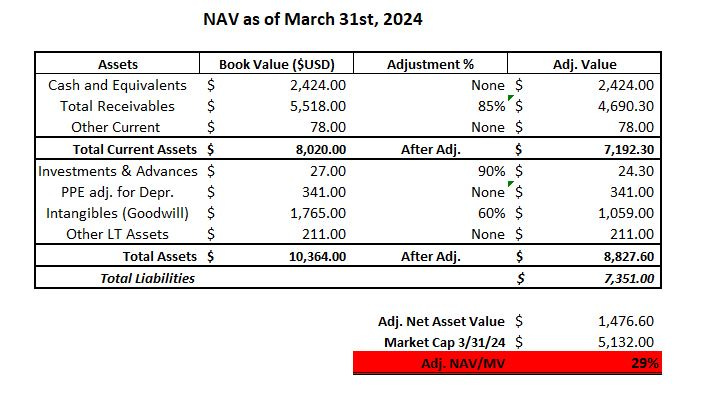
What changed was our adjusted NAV dropped slightly to USD $ 1,476B but the market cap nearly doubled, changing the original risk/reward profile of the investment. At the higher valuation, our exposure to downside risk increased from 40% to nearly 70% from a NAV perspective. It’s important to remember that investments are not just valued in absolute terms but also relative to other opportunity sets. For us to invest in a fintech business (ever-changing industry dynamics) domiciled in Brazil (less familiar political, socioeconomic, and regulatory framework), we require a larger margin of safety than would be required for a business in a more stable industry with lower external risk factors.
From an operating perspective, Stone’s latest results also gave us some cause for concern. For example, selling expenses increased 36% year over year, while consolidated revenue grew just 14% over the same time-period. The management and board of directors have gone through numerous changes, most notably at the CEO and CFO levels since our initial investment. The latest quarter also saw Stone make an internal accounting change to revenue recognition for membership fees. The revenue is now being deferred throughout the lifetime of the client. When asked about this change on the latest earnings call, management told investors that they do not disclose how many months are currently being used to calculate customer lifetime value.
While this might be considered a minute detail in analyzing an entire business, we do care about how management communicates with investors, the simpler and more straightforward, the better. Any attempts to obfuscate data through accounting practices or language raises red flags for us. For example, a manager that must increase marketing spend due to higher competition might tell analysts they are “investing in their brand” as a euphemism. This is not to say anything illegal or fraudulent is happening at StoneCo, only that matters of risk/reward can change through qualitative as well as quantitative factors.
Revisiting PayPal PYPL 0.00%↑
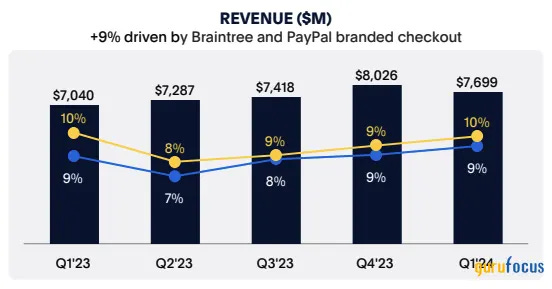
PayPal's stock has underperformed so far in 2024, down nearly 3% year to date while the broader market saw a 14.50% increase. The stock's muted price action reflects a lack of growth catalysts and an increase in competitive threats, most recently from Apple AAPL 0.00%↑ with their introduction of "Tap to Cash" at its Worldwide Developers Conference. Despite these challenges, PayPal managed to deliver a promising Q1 earnings report.
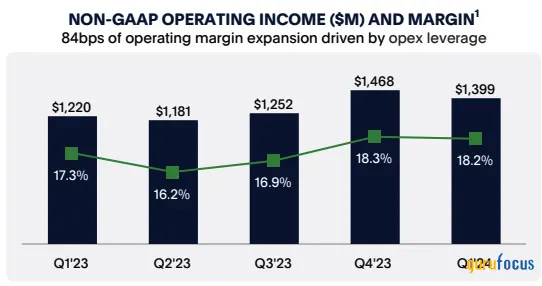
In the latest quarterly earnings release, PayPal exceeded revenue and earnings per share consensus estimates, signaling positive momentum for the company. Revenue grew by 9% year over year, driven primarily by increasing transaction revenue. Despite a slight decrease in the number of active accounts, the number of payment transactions per active account grew by 13%, mitigating any negative impact on the top line. PayPal's focus on cost discipline is evident as profitability outpaced revenue growth. Operating income increased by 17% year over year, significantly outpacing revenue growth, which allowed the company to boost non-GAAP earnings per share by 27%.
The company generated adjusted free cash flow of $1.9B for the quarter and $5.4B over the last 12 months. Much of this free cash flow is currently being used to repurchase shares at what we believe to be attractive levels. On a trailing 12-month basis, share repurchases of $5.1B reduced weighted average shares by 5%. Management told investors on the earnings call that they expect Free Cash Flow for 2024 to come in at approximately $5 billion and to spend at least $5 billion for share repurchases.
PayPal’s Earnings Power Value
At the time of writing PayPal is valued at ~$60B, or $59 per share. This translates to a 14.86 times TTM earnings ratio, (significantly below the P/E ratio of over 20 for the S&P 500), a price to book of 3 times, and a FCF yield of 8%. In its current state, PayPal is trading at its lowest valuation in its 9-year public history for P/E, P/B, and P/FCF, indicating a severely pessimistic outlook by the market. We have previously written about PayPal HERE, where we valued the business using a traditional DCF Model.
Rather than taking another look at PayPal using a DCF, today we are going to be valuing PayPal using the more conservative EPV Model (Earnings Power Value). EPV is a method of valuing a company, assuming that the current earnings are sustainable, and there is no future growth. This allows us to understand what the business would be worth in a steady state normalized environment.
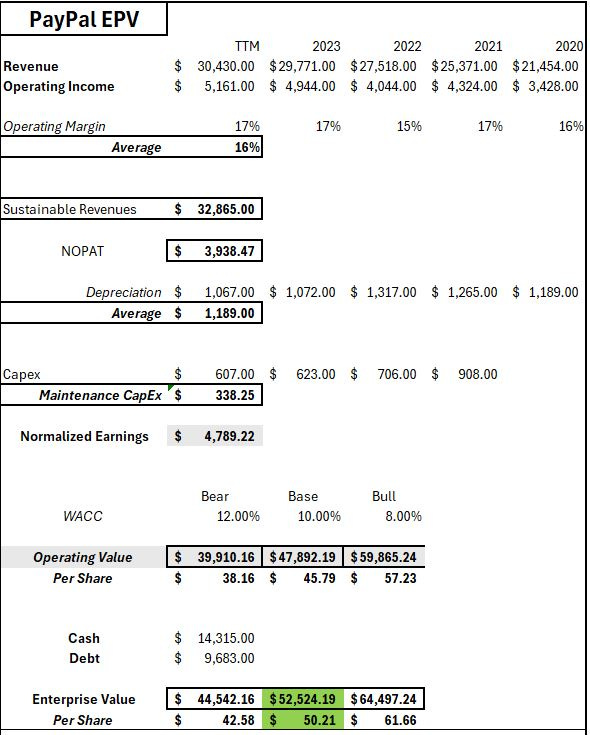
Based on our model, we can see that PayPal’s EPV can range from $42 to $62 per share. At its current price, the market is pricing in little to no growth for PayPal going forward. We find that this pessimistic outlook does not line up with the history of the business or with its current situation:
PayPal holds 45% of the global payments market share, making it the #1 payment processor globally.
PayPal has 426 million active users, comprising consumers and merchants.
36 million merchants use PayPal in over 165 countries worldwide, a CAGR growth of 10.76% over the past five years.
Businesses using PayPal have 25% better conversion rates than their cohorts.
Large enterprises that use PayPal see 33% more completed checkouts than traditional payment methods.
Shoppers paying through PayPal spend 12% more than those using other payment methods.
PayPal users purchase 60% more frequently compared to other digital buyers.
In summary, we do not think PayPal’s growth trajectory ends here. The business has a worldwide footprint with network effects in some of the fastest growing industries such as digital payments, ecommerce and Buy-Now-Pay-Later.
The Portfolio
Since inception, we have made 16 investments in 7 industries as classified by Morningstar. While the investments span throughout various sectors, there is material concentration in the sectors of internet retail, financial services, and cloud computing. We anticipate high volatility in the fund due to portfolio concentration, emerging market risk (largely in China), and a contrarian investment strategy. We would like to thank our partners and readers for their continued support.
Until next time,
Jack Beiro, MBA
JB Global Capital
The information contained herein represents the author’s opinion and is for informational purposes only. Nothing in this newsletter should be construed as legal, tax, investment, or financial advice. No opinion expressed by the author should be construed as a specific inducement to make a particular investment or follow a particular strategy. The author may hold positions in securities mentioned in the newsletter and may buy or sell securities at any time. The author may express opinions based on information he considers reliable, but no guarantee or warranty is made with respect to such information’s completeness or accuracy, and the author is under no obligation to update or correct any information provided. Please consult your own financial or investment advisor before acting on any information provided herein.